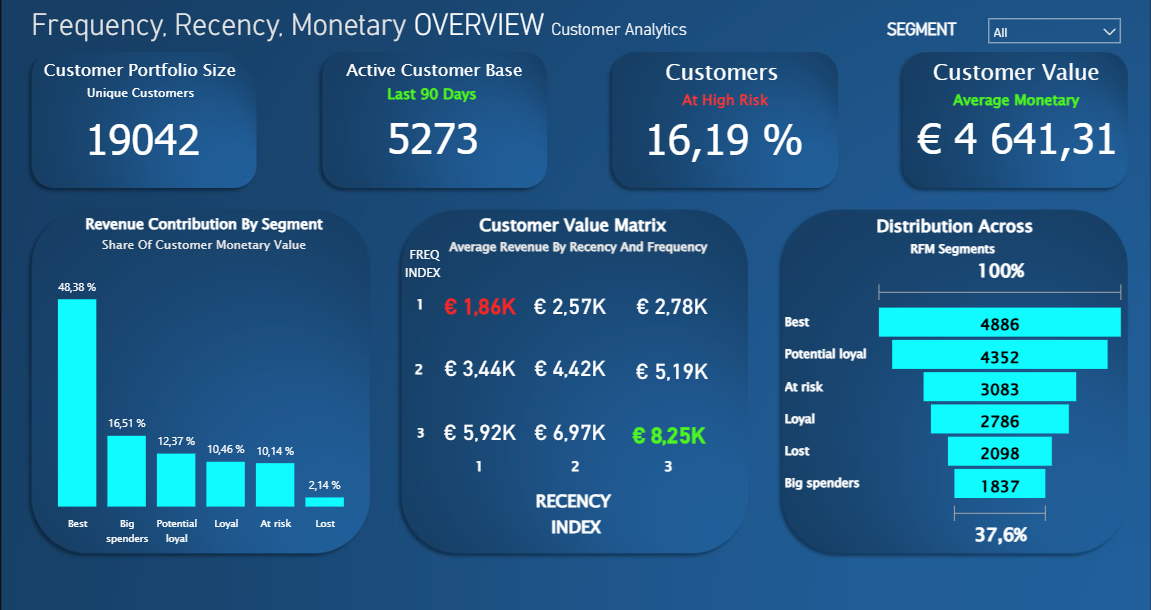
This dashboard gives a clear view of how the customer base is performing – which groups contribute the most value, which ones are slowing down, and how much of the portfolio remains active. Everything is built around the RFM model (Recency, Frequency, Monetary), where each customer receives a score based on purchasing behavior over time.
The entire model sits on a structured SQL database with separate dimensions for customers, dates, and products. All RFM calculations are done directly in SQL, which keeps the segments stable and avoids inconsistent filtering in Power BI. The result is a reliable overview of customer value that goes far beyond standard sales reporting.
Key Features
- Full RFM segmentation (Best, Potential Loyal, At Risk, Lost, etc.)
- Active customer base over the last 90 days and share of customers at risk
- RFM value grid showing exactly where value is created
- Monetary value distribution per segment in both percentages and totals
- Total customer portfolio size, average value, and risk profile
- SQL-based data model for consistent and reliable calculations
The goal is to give marketing, CRM, and leadership a simple and fast way to understand the customer portfolio – who drives the business and who needs attention.