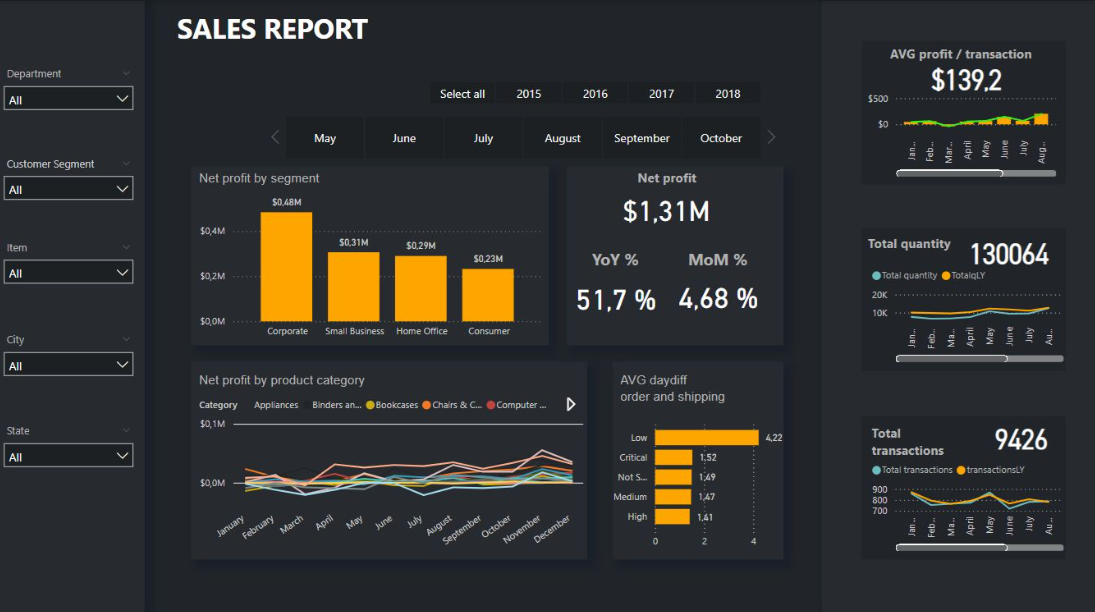
Complete sales dashboard in Power BI, built to give decision‑makers a clear and fast view of how the business performs. Everything is optimized for quick loading, simple filtering, and KPIs that actually answer the questions people ask: What drives profit? Which segments perform best? Where do we lose margin over time?
The model is built on a clean star schema so every number stays consistent across the report. All calculations use well‑structured DAX with variables and controlled filter logic to avoid the usual “why doesn’t this match?” problems. The goal is simple: one page that shows what matters, without having to dig.
Key Features
- Net profit split by segment, product category, and month
- YoY & MoM % changes
- Avg profit per transaction, total quantity, total transactions
- Order vs shipping day‑difference logic
- Smart filtering by year, month, customer segment, product, and location